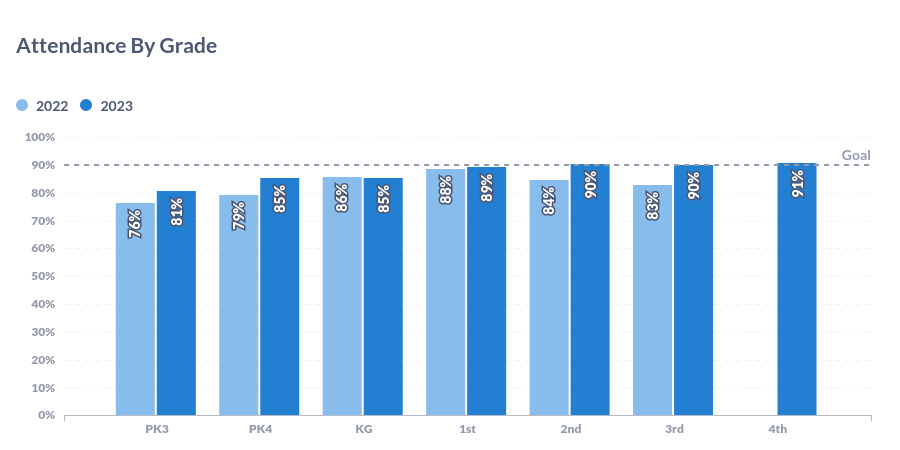
This page shows how to build three different versions of the same graph. The only difference is the custom formula that is utilized in the green, left-side Summarize.
Sample Output
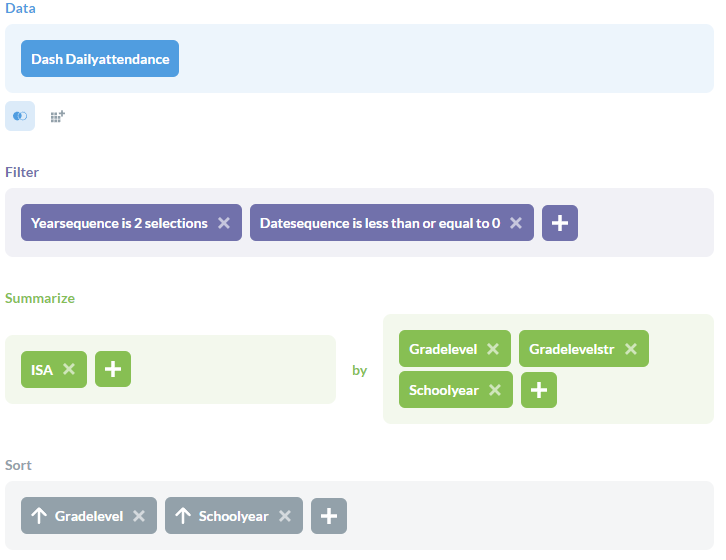
Question Editor
Note: YearSequence = -1, 0
Formulas
ISA | CountIf([Present] = "True") / Count |
| Chronic Absenteeism | CountIf([Chronicallyabsent] = "True") / Count
|
| Truant | CountIf([Truant] = "True") / Count
|
Visual Settings
Data | X-axis GradeLevelStr SchoolYear - Prior SY: Light Blue, 2022
- Current SY: Dark Blue, 2023
Y-axis |
Display | Stacking: Don’t Stack Goal Line: Yes (for Attendance) Show values on data points: Yes |
Axes | X-axis: - Show label: No
- Scale: Ordinal
Y-axis: - Show label: No
- Auto y-axis range: Yes
- Scale: Linear
|
Customizations
Notes on how to customize at different schools